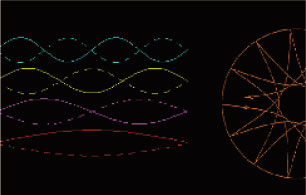
Propagation Diagram

Propagation diagram of a stellar model of 1.8 solar masses. The equilibrium model originates from Antonio Claret (claret [at] iaa.es), and the frequencies were calculated by Rafael Garrido (garrido [at] iaa.es).
The vertical axis gives the oscillation frequencies of the model in natural units of the star, meaning that their square is divided by GM/R3,, and the horizontal axis gives the radius, with R=1 being at the stellar surface. Each point is an oscillation node, which is a point in the stellar radius where the oscillation amplitude is zero. The diagram also indicates the Brunt-Väisälä frequency (N) which is the natural frequency of vertical oscillations of a fluid element that is allowed to oscillate freely in the interior of a star. The Lamb frequency (L), which is the frequency of a horizontal wave, is also shown in the diagram, for the spherical harmonics with l=2, scaled to the sound speed in that region.
There are two series of modes: for the series of pressure modes, P, the number of nodes increases with increasing frequency. The restoring force in these modes is pressure, and they are pressure waves. In the other series, G, happens the opposite and the number of nodes increases with decreasing frequency. In this case the restoring force of the oscillator is basically gravity; thus they are called gravity waves.
The denominations 'P' and 'G' refer then also to depths in the stellar interior where the waves that are able to pass through have the character of pressure or gravity waves.
The model shown in the diagram is for an unevolved star, meaning a star at the begin of its hydrogen burning phase. This diagram changes completely when the star evolves, which makes it useful as a tool in the study of the stellar interior. The change is caused mainly by the gravity modes, which gradually intrude into the frequency range of the pressure modes, giving rise to mixed modes, which behave like gravity modes in the interior and pressure modes in the exterior. Another evolutionary effect is the appearance of more modes within the same frequency ranges, causing a denser frequency spectrum. The direct observation of the modes, and comparison with models, gives then stellar ages with high precisions and will tell us how a star's physical.


")